


Wondering how to interpret trading tools’ indicators for better trading and decision-making? Check out some tips to using the most popular technical indicators.
Please note this is not trading advice and any information taken from this article should be assessed with caution. Banner image courtesy of Viktor Forgacs
When it comes to online trading, having access to the right tools is only half the battle. The key power lies in knowing how to interpret them. Technical indicators help traders understand how the market is moving and assists in better decision-making, but unless you understand what those indicators are telling you, they are simply confusing lines on a chart. Let’s take a closer look at the widely used technical indicators and how to interpret them.
Moving Averages (MA)
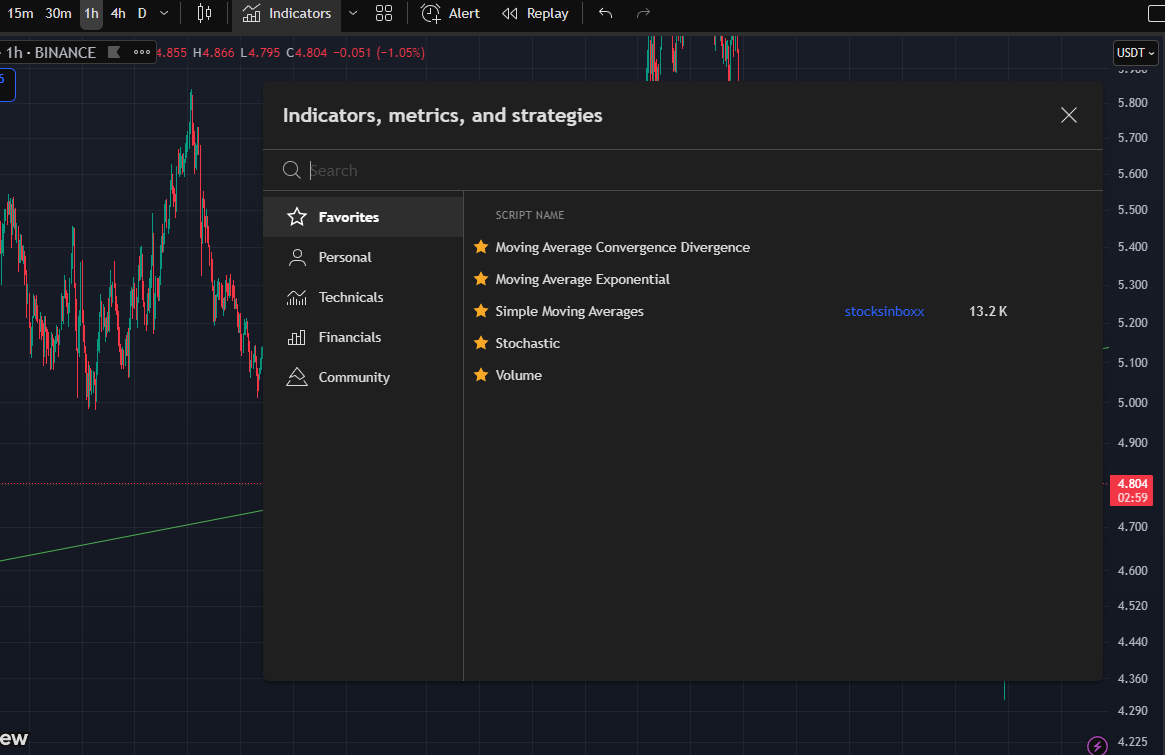
A Moving Average smooths out price data over a set period, creating a line that helps highlight the overall direction (trend) of a market. The two most common types are the Simple Moving Average (SMA) and the Exponential Moving Average (EMA). The EMA has a greater impact on recent price action, making it more responsive to current market conditions.
When using TradingView, traders can overlay multiple moving averages and easily customize their periods and types, making it easy to set up crossover strategies or trend-following systems.
To use moving averages, there’s a need for trend identification. If the price is consistently above a moving average, it signals an uptrend; below the average means a downtrend. MAs also act as dynamic support and resistance levels where prices tend to bounce.
You can also apply the crossover strategy to Moving Averages. A classic signal comes from watching two MAs of different periods, like the 50-day and 200-day. A bullish crossover happens when a shorter MA crosses above a longer MA and suggests a potential buying opportunity. Meanwhile, a bearish crossover happens when the shorter MA dips below the longer MA, signaling a sell.
Relative Strength Index (RSI)
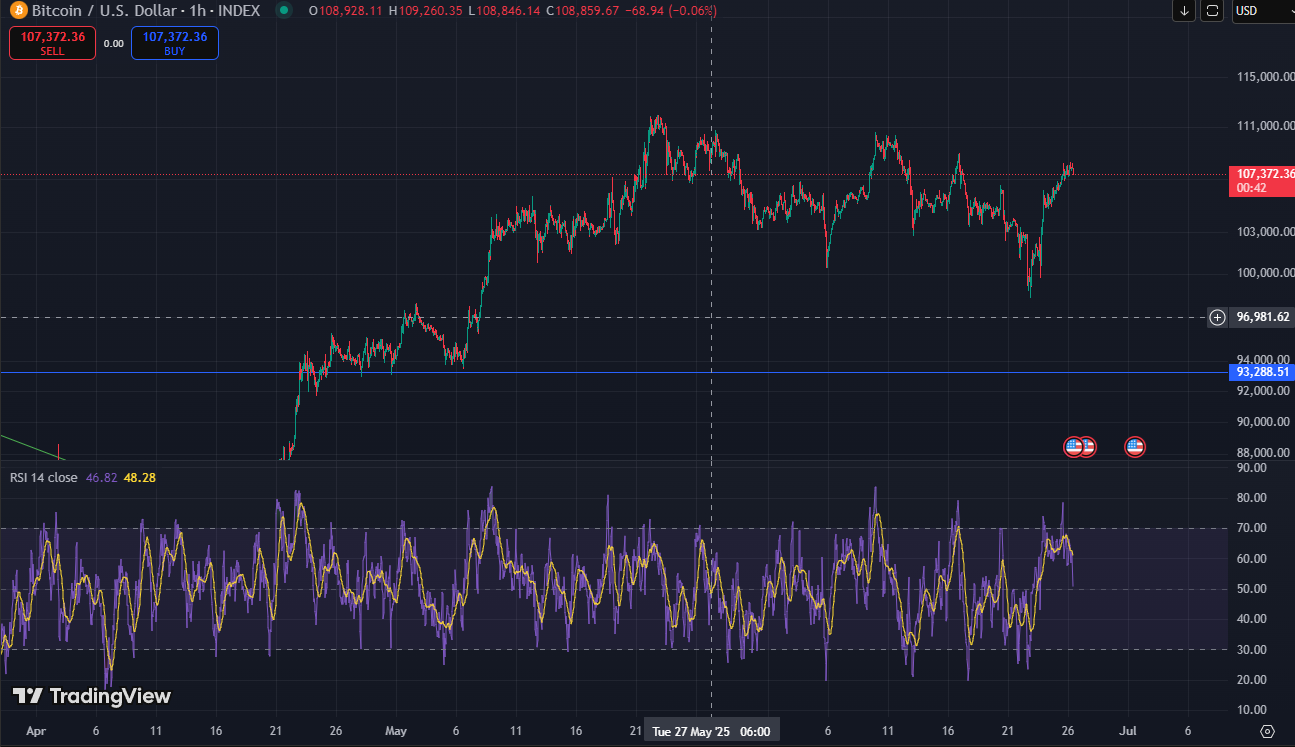
The RSI is a momentum oscillator that measures the speed and change of price movements. It goes from 0 to 100 and is used to identify overbought or oversold market conditions.
An RSI above 70 typically signals an overbought condition, suggesting that the price may be due for a correction or pullback. Below 30 indicates overselling, which means there’s a potential rebound or buying opportunity.
If the price of an asset is making new highs but the RSI is not, it is termed bearish divergence and it indicates weakening momentum. The opposite is bullish divergence, which signals a potential price increase. In an uptrend, RSI often remains above 50, but in downtrends, it tends to stay below 50.
Moving Average Convergence Divergence (MACD)
The MACD is a trend-following momentum indicator that shows the relationship between two EMAs, usually the 12-period and 26-period EMAs. It consists of an MACD line, which is the difference between the two EMAs. It also has a signal line, which is a 9-period EMA of the MACD Line. Another feature is the histogram, which is a visual representation of the distance between the MACD Line and the Signal Line.
The MACD can be used in crossover signals. A bullish crossover occurs when the MACD line crosses above the signal line, and is a potential buy signal. A bearish crossover is the opposite, with a potential sell signal.
Another way to use the MACD is with zero line crosses above the zero line, which confirms an uptrend. Below zero, however, suggests a downtrend. Just like RSI, divergence between price and MACD signals a potential trend reversal.
Bollinger Bands
Bollinger Bands consist of three lines. There’s a middle band, an upper band (a middle band and two standard deviations), and a lower band (the middle band minus two standard deviations). It is used to measure volatility.
When the price breaks out above the upper band, it might indicate an overbought condition, while below the lower band indicates oversold. However, the latter can still signal a strong trend continuation.
A narrowing of the bands is called a squeeze and indicates low volatility, often preceding a breakout. Another situation that can occur is a mean reversion, when prices tend to revert back to the middle band over time. Traders use this to anticipate retracement after extreme moves.
Combining Indicators For Stronger Signals
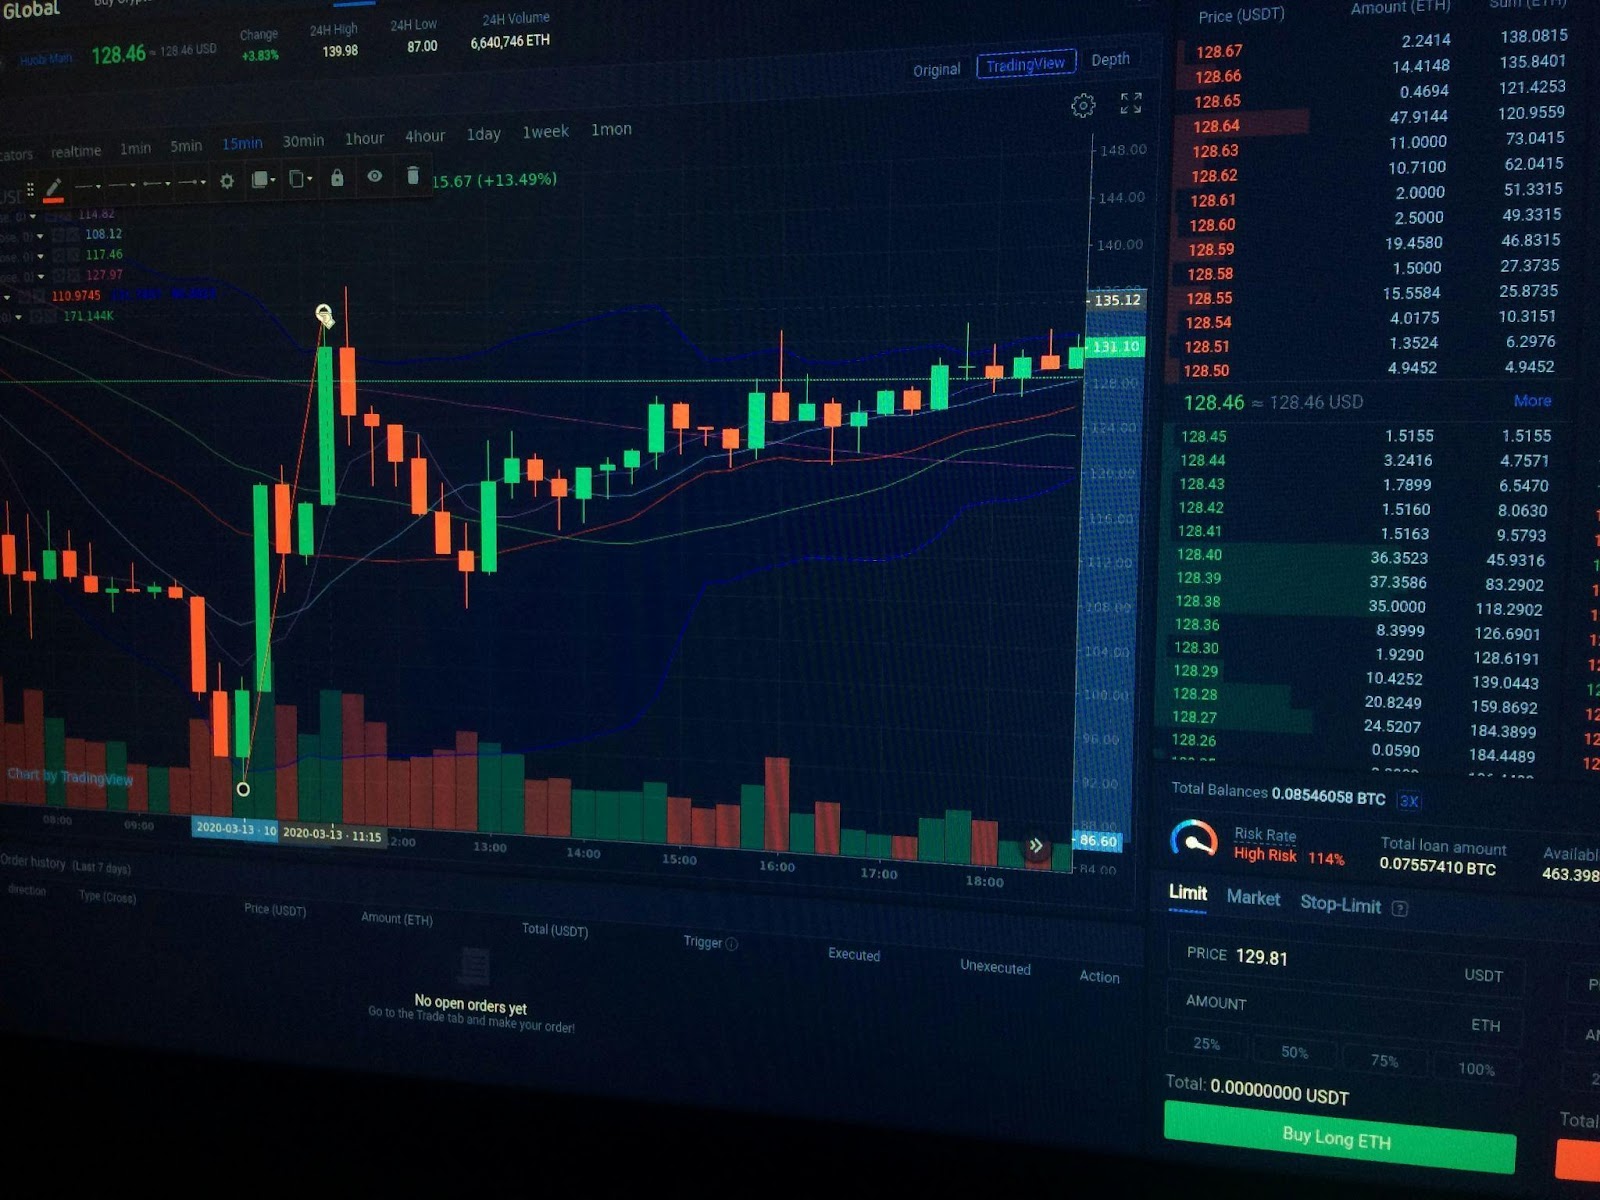
Source: Vladislav Maslow via Unsplash
No single indicator should be used on its own. The best trading decisions come from using multiple signals at the same time. Trading platforms allow users to layer multiple indicators onto a single chart, set alerts for key conditions, and even backtest strategies using historical data. Some ways to combine indicators include:
- Combine a MACD crossover with an RSI divergence for added confirmation of a reversal.
- Use moving averages to establish the trend and Bollinger Bands to pinpoint entry/exit during high or low volatility.
- In an uptrend confirmed by MAs and MACD, look for RSI pullbacks as potential re-entry points.
Tips For Interpreting Indicators Effectively
To use technical indicators effectively, here are some tips to help you out:
- Always be aware of overall market conditions. Indicators can give false signals in choppy or sideways markets.
- Too many indicators can lead to analysis paralysis, so stick to a few reliable ones that you understand well.
- Check your indicators across timeframes. A trend on a 1-hour chart might look different on a daily chart.
- Use indicators to support your understanding of price action, not to replace it.
Using Technical Tools For Better Trading
Interpreting trading tools’ indicators are important for traders to make better decisions. By understanding how popular indicators like MAs, RSI, MACD, and Bollinger Bands work, you can navigate the markets with more confidence. Technical tools are a part of a well-thought-out strategy, so consider combining multiple indicators, analyze the market condition, and make use of multiple timeframes.